Somebody decided to buy from you today. Were you there for them?
Think about what has to happen before a person fills in your demo form.
They have a problem they have decided to spend money on. They have searched, read, compared, and landed on you. Somewhere in that they stopped being a visitor and became a buyer, and then they did the one thing that costs them something. They put their name and their phone number into a box on your website and asked to talk to a human being.
That is the most expensive visitor you will get all week. The ads, the content, the SEO, the events, the SDR who has been nurturing them for six weeks. All of it exists to produce that single moment.
And then nothing happens.
Not always nothing. Usually a robot writes back within a minute or two to say your inquiry is important to us. Occasionally, much later, a person appears.
I have been watching this since 2021 and I have never shaken the feeling that the industry is optimizing the wrong end of the problem. Everyone wants more leads. Nobody seems to want the ones they already have.
So I stopped guessing and measured it, three times. We classified 4,265 B2B websites in 2021, went back to the same addresses in 2025, and went back again in 2026. Separately, in 2023, we submitted a demo request on 2,528 B2B company websites and read what came back.
The third wave changed what I think the first two measured.
Every company in both studies clears 10,000 website visitors a month. That gate was set on purpose. These are not businesses nobody visits. They are businesses that paid to be found and then did not answer the people who found them.
And the visit is getting scarcer. The share of US desktop searches that ends in a click on anybody's website fell from 44.9% in March 2026 to 40.0% in June, the lowest reading in the window Datos publishes. (Datos, a Semrush company, with SparkToro, State of Search Q2 2026, page 10, US desktop.) Fewer buyers arrive at all, and the ones who do have done their reading somewhere you cannot watch. So the moment this report is about, the one where somebody finally asks, is rarer than it used to be. The identification tax follows that through.
1. Five years of selling conversation, and fewer places to have one
Websites with no chat at all rose from 64.0% to 72.3% between 2021 and 2025, and stood at 74.1% in 2026. 4,265 matched sites in every wave. 2,731 sites, then 3,083. The 2026 figure is a weighted estimate carrying a 95% confidence interval of 69.1% to 79.1%, so it does not settle whether anything moved after 2025.
753 sites took chat off between the first two waves. 401 put it on.
Every category report says the opposite and I do not think anyone is lying. They are counting a different thing. Category reports count vendor revenue and seats sold. We counted websites from the buyer's side of the glass, and a vendor can raise prices, move upmarket and grow revenue while appearing on fewer sites every year.
For four years I reported one bright spot in this data. Sites where a buyer could reach a person had risen from 3.7% of the study to 14.1%. I no longer think that is what we measured.
2. Given the choice, the industry promised rather than staffed
Sites where a buyer could reach a person rose from 158 to 601, 3.7% to 14.1%. Staffed chat did not move: 140 sites, then 111. The entire rise was a bot offering to fetch somebody: 18 sites in 2021, 490 in 2025. 4,265 matched sites.
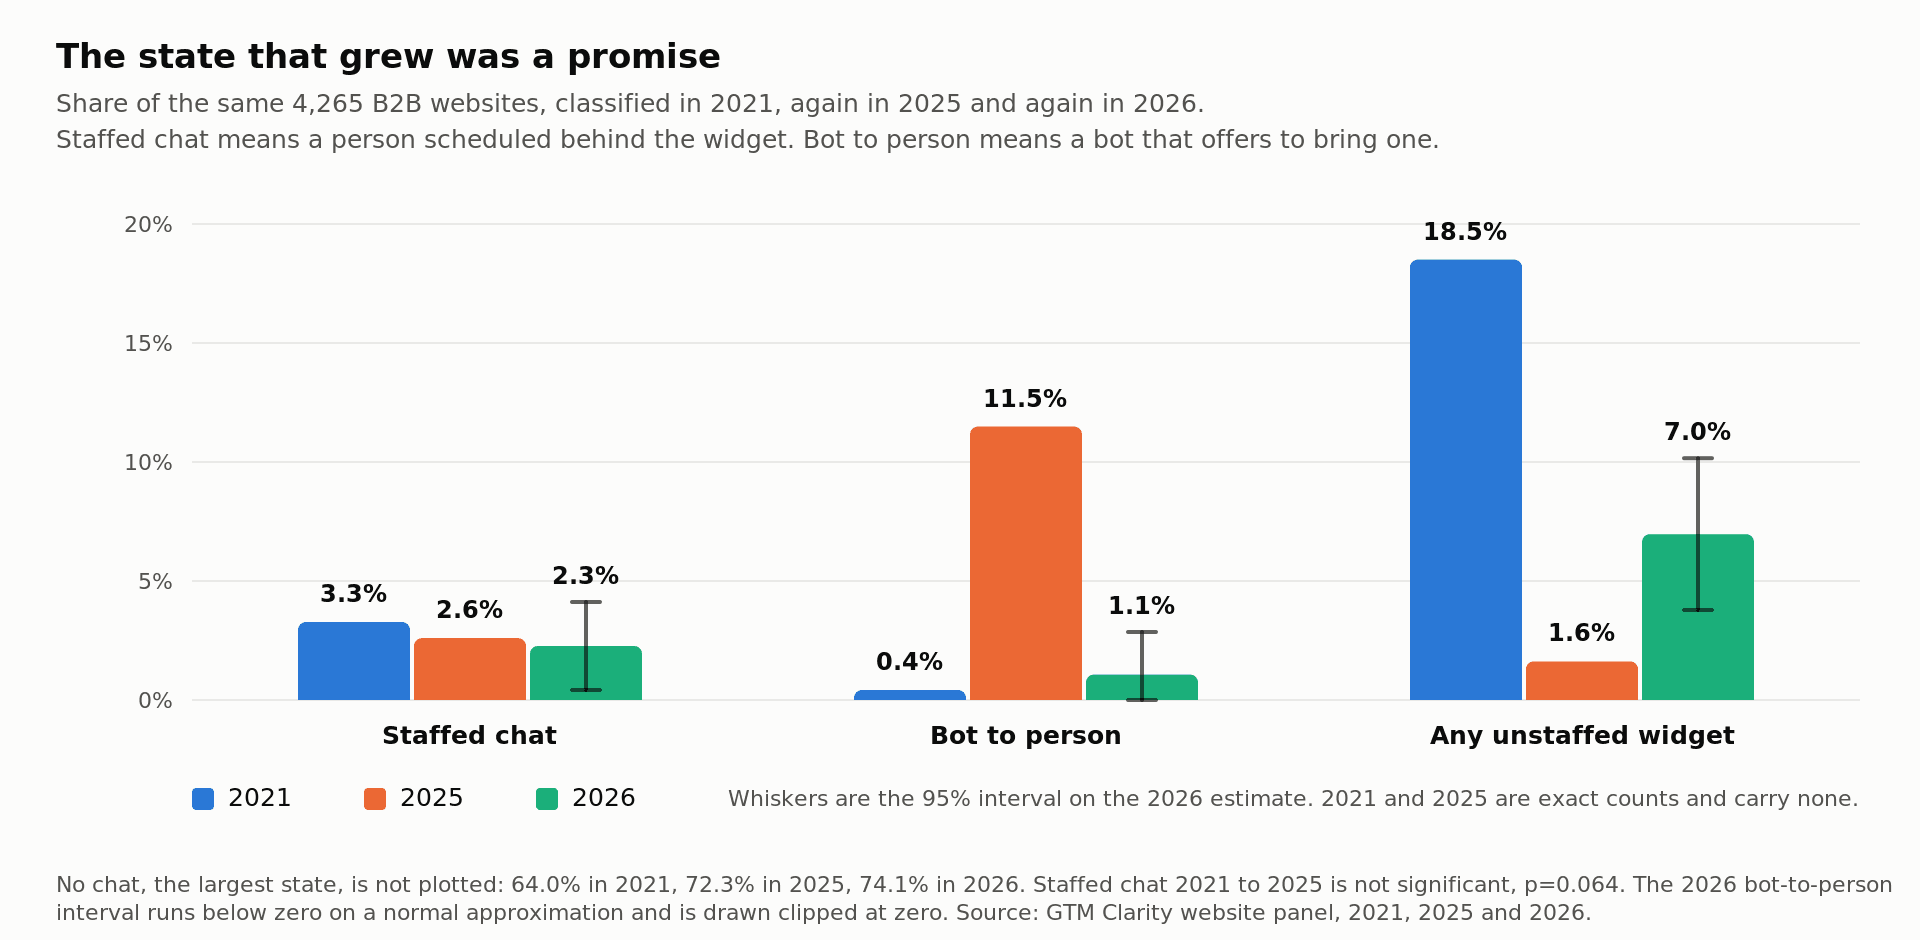
Those are two different things and for four years I published them as one number.
A staffed chat is a widget with a named person on a schedule behind it. A bot to person is a bot that offers to bring one. Both waves classified a site by opening the widget and looking, which records that the offer was on the screen. Neither wave tested whether anybody arrived.
So the measure that went up is the one whose meaning depends on a promise being kept.
The measure whose meaning is fixed did not go anywhere. Staffed chat was 3.3% of the study in 2021, 2.6% in 2025 and 2.3% in 2026. The 2021 to 2025 change is 0.68 points down with a 95% confidence interval of 1.38 down to 0.02 up, so the study cannot separate it from no change at all. Across five years and three waves, the share of B2B websites where a named person is scheduled to answer a buyer has stayed at about one in forty.
The bot-handoff state over the same period went from 18 sites to 490, a rise of 11.07 points.
Where the unstaffed widgets went. In 2021, 789 sites, 18.5% of the study, had a chat widget with nobody behind it. By 2025 that was 69 sites, 1.6%. Every one of the 789 had already paid for the software, so the cost was sunk and one operational question sat in front of each of them, which is whether anybody was accountable for answering it.
| What happened to a 2021 unstaffed widget | Sites | Share of 789 |
|---|---|---|
| The widget was switched off | 391 | 49.6% |
| A person was put behind it | 55 | 7.0% |
| A bot was put in front of it, offering a person | 174 | 22.1% |
| A bot was put in front of it, offering nothing | 138 | 17.5% |
| Still unstaffed four years later | 31 | 3.9% |
Removal beat putting a person behind it by seven to one.
In 2026 we stopped looking and started asking. The third wave coded each site by opening the chat, asking a buyer's question, and waiting three minutes.
The promise failed almost everywhere it was tested: 4 of 88 judged bot handoffs produced a person, 4.5% on a 95% confidence interval of 1.8% to 11.1%. The schedule held up better and still mostly failed, at 22 of 104 judged, 21.2%, on a census of that whole state.
One survey platform's bot promised a live person twice, took a phone number against a connection it never attempted, and when the buyer challenged it a third time answered "fair point, I haven't earned trust here." Then it asked four more questions. It ended the conversation holding nine fields on somebody whose only request had been to talk to a person.
So a named rota outlasts a promise by roughly five to one, and four in five of them still lapsed inside a year. What the other bots did instead is ten filed transcripts, read one at a time.
And the widget with nobody behind it came back. Any unstaffed widget was 1.6% of the study in 2025 and 7.0% in 2026, 95% confidence interval 3.8% to 10.2%. The interval excludes the 2025 figure, so that one did move. Of the 104 staffed sites we could judge in 2026, 33 are now running a widget with nobody behind it.
For the buyer, switching it off is the honest choice. An invitation nobody answers is worse than no invitation, and it does more damage, because they accepted it before they found out.
3. Drift's customers did not switch. They quit.
Of the 319 study sites running Drift in 2021, 164 had no chat at all by 2025.
The received account is that Drift faded, its customers evaluated the alternatives, and the market redistributed. In our study they did not redistribute. The competitive reallocation everybody wrote about is real, and it is a fraction of the size of the exit.
The reason is sitting in the 2021 data. 315 of the 319 Drift sites, 98.7%, had no human reachable while they were still paying for it. Almost every one was running a bot with nobody behind it. Four could put a buyer in front of a person.
Four.
Across every site in the study running chat of any kind in 2021, about one in ten could reach a person. Among the cohort that had bought the most opinionated product in the category, it was one in eighty. The companies that had gone furthest toward buying conversational software were the least able to have a conversation.
So there was nothing to preserve, and nothing forced the decision either. Salesloft bought Drift in February 2024 and did not publish an end date until 2026, setting retirement at 31 January 2027. The sites that went dark by 2025 switched off a product that was still live and still supported. They were not walking away from a channel that had disappointed them. They were closing an account on something that had never once been answered.
The third wave says this was not a Drift problem. Staffing that did happen mostly did not hold, on every kind of site we looked at.
4. Better than nine in ten never put a human in front of a buyer who asked for one
1,573 of 1,685 companies, 93.4%. Demo response study, fieldwork 2023.
Treat this one as a baseline rather than a current reading. It is three years old and it is the oldest thing in this report, which is why the website study leads.
Picture the person on the other end of it. They did the hardest thing your funnel asks of anybody, which is to stop reading and identify themselves. Then they checked their inbox that afternoon. And again the next morning. Nobody told them no. Nobody told them anything at all. What they worked out on their own is that this is a company which does not answer, and that is now the first thing they know about you.
In plain terms, a buyer who asks to speak to someone has about a one in fifteen chance that anybody turns up.
Every company in this study has a slide with customer centric written on it.
Two limits belong in the same breath as the number. We captured email only, so a company that telephoned and never wrote is counted here as never having answered. And collection stored two emails per company, so this is the rate inside the first two.
5. Speed measures the machine
A third of first replies arrive inside five minutes, 545 of 1,685. The ones we read by hand were software.
That count is a timestamp subtraction and rests on no judgment about who wrote anything. What we read by hand was a small non-random batch of them, so treat it as a sighting rather than a rate. Nearly two thirds of the 545 came from the part of the corpus already carrying bulk mail infrastructure, and across the whole study nobody found a person behind any of that.
Then the part that runs backwards. Among the emails we classified by hand, the ones a person wrote took a median of 765 minutes and the automated acknowledgments took 281. Human replies were slower by a factor of nearly three, because a person who goes and checks something before writing takes time to do it and a template does not. That comparison rests on 17 human verdicts against 162, so read it as direction rather than as a measurement.
The logic holds without either number. A metric that times every response is set by whichever class of response is most numerous, and in this study that is overwhelmingly the machine. So a company driving its median response time down is driving down the speed of its autoresponder, and the dashboard will report improvement while the buyer meets a market with almost nobody home.
Speed is not worth a penny if there is no value in the response.
The market has already answered a question this study cannot
Several hundred companies in this study bought chat, watched what it produced, and decided what to do about it. Each of them held something nobody outside their business has, this study included: their own numbers. What a conversation was worth to them, set against what the software and the staffing cost.
Of the 789 sites running a widget nobody answered, seven switched it off for every one that put a person behind it. On their own evidence that was the right call. A widget nobody answers produces nothing to measure, and the version they had tested was the version the category sold them.
Fifty-five of the 789 ran the other experiment.
The ones who did staff it mostly stopped. Of the 104 sites with a person scheduled in 2025, 22 still reached a human a year later. Another 33 were running a widget with nobody behind it. Staffed chat has not grown in five years of this data, and it did not grow among the companies holding first-hand evidence about whether it works.
None of that establishes whether being there pays. Nothing visible from outside a website can establish it, and this study has no outcome data of any kind.
It establishes something narrower. The decision keeps being taken without the test being run. Almost every company here concluded that answering a buyer was not worth the cost, having never answered one.
The metric this replaces
There is already a metric here. It is called Speed to Lead and it has been in nearly every sales enablement deck for fifteen years.
Read the phrase and notice who is in it. The company is the subject. The buyer appears as an object called a lead. The thing being timed is the seller's internal handling of its own paperwork. It is a stopwatch held by the wrong person.
Buyer Wait Time is the time between a buyer explicitly asking to reach a person and a person answering.
Same event, timed from the other end of the telescope. Not how fast you processed them. How long they waited.
The clock starts on a request, not a visit. Browsing does not start it. A question the bot answers to the buyer's satisfaction does not start it. What starts it is an action whose whole purpose is to reach a human. A company whose buyers genuinely serve themselves is not punished for it. If nobody asks, there is nothing to measure.
The clock stops when a human answers. Not an autoresponder, not an acknowledgment, not a bot. The practical test is whether the reply contains a fact that did not come from the form.
It does not care which channel. Chat, email, a phone call, whatever works. A company with no chat widget that answers a demo request in four minutes scores better than one running staffed chat that ignores its own form submissions.
Closed and unanswered are different failures. A company with no way to request a human is closed. That is a design decision and for a genuinely self-serve product it can be the right one. A company that offers the path, watches a buyer take it, and never answers is unanswered. I have yet to hear a go-to-market philosophy that defends the second one.
A Buyer Wait Time is never reported on its own. It goes next to the share of buyers who never got an answer at all, because a median calculated on the people you did answer describes your best behavior and deletes everybody else. The full metric specification is published for anyone who wants to adopt it properly.
Score your own inbox in ten minutes
You already have the data for the first test. It is sitting in the inbox your inbound form writes to.
Step 1. Open the shared inbox that receives your demo or contact sales submissions. Take the last twenty replies your company sent to a form submission.
Step 2. For each one, look for a single thing: a fact the sender could not have got from the form. Something they went and looked at, and then said. The product line the buyer's site actually sells. What happened when they rang the number. Something on a profile they had opened.
Names, company names and domains do not count, because those came from the form. Neither do two suggested meeting times, because scheduling software proposes those on its own.
Step 3. Mark each of the twenty yes or no on that test alone. Not tone, not length, not whether a named person sent it.
Step 4. Count the yes rows. In our hand classified set that signal appeared in 14 of 17 replies a person wrote and in 5 of 162 automated acknowledgments, which is the only feature in the whole corpus that told the two classes apart. Your yes rows are the replies a buyer would recognize as a human being.
Step 5. Sort both groups by how long they took. If your yes rows are your slowest rows, your response time dashboard is tracking the machine.
Then run the harder version, which takes a week of waiting and no work. Have somebody outside your sales and marketing team fill in your own demo form from an address nobody recognizes. Tell nobody, because a warned team gives you your team's best behavior and you already know what that looks like. Log every email that arrives with its timestamp, and note whether the form actually submitted, because on 31.6% of the sites we tried it did not.
Your Buyer Wait Time is the time until the first reply containing a fact from outside the form. If none arrives, your Buyer Wait Time is never answered, and that is the answer.
Run it on three competitors while you are at it.
How we did it, and what it cannot do
The study. B2B technology websites drawn at random in 2021, each above 10,000 monthly visitors, classified by how a buyer could reach a human, then revisited at the same addresses in 2025 and again in 2026. Matching 2021 to 2025 on domain gives the 4,265 sites the study is built on. They are the same sites in every wave rather than three separate samples, which is what lets it measure change inside a site rather than infer it from a shifting crowd. The 2026 wave sampled within it rather than revisiting all of it, so most of the 4,265 carry no 2026 classification. Every 2021 and 2025 figure above is a count of observed states, with no coder judgment about intent and no estimation.
The third wave is a different instrument. Every 2026 figure here is labeled as one. 2021 and 2025 classified a site by opening the widget on one visit. 2026 held a conversation: a buyer's question, then a fixed three minute wait, in US business hours. It is also a sample rather than a census on the three big groups, which is why 2026 figures carry confidence intervals and the first two waves do not. A machine sweep ran first to find chat, and it missed chat on 45 of 155 live sites it had called empty, 29.0%, so any 2026 count of chat presence is a floor. Full method on the website panel page.
The demo response study, 2023. 2,528 B2B companies were sent one demo or contact sales request each, through their own website form, from an address they did not recognize. Every submission came from one buyer identity: a VP of Engineering at a 200 person software company in San Francisco. That identity carried a LinkedIn profile and the company had a website, which is what makes the classification test checkable. 798 forms could not be submitted and 45 errored, leaving a usable base of 1,685. Whether a person wrote a reply was decided by hand, one email at a time, across two independent batches drawn group by group and reweighted to the 1,685. Full method on the demo response study page and the classification rulebook.
What it cannot do. The demo study measured email, so it cannot tell you that nobody picked up a phone. It can put a floor under it. 50 of the 1,685 companies, 3.0%, sent an email in which the sender said they had called or left a voicemail. That is a floor and not a rate, because a call nobody mentions afterwards is invisible to us, and so is a call to a company whose email we could not read. It has no outcome data of any kind, so it cannot tell you what works, only what happened. It was built to measure one rate precisely and cannot resolve differences between types of site, so we publish no subgroup comparison of the never-answered rate. And every vendor share figure sits on detection coverage that fell 24 points between the waves, which is why those are published as ranges with install counts beside them. Presence figures carry none of that. Detecting that a site has chat is reliable. Attributing it to a vendor is not.
Prior work. Two studies ran this design before us, and both counted whether a reply arrived: a 2011 Harvard Business Review audit of 2,241 US companies and Drift's 2017 version on 433. This set adds two things neither had. A hand classification of whether a person wrote the reply, and a matched panel that watches the same 4,265 websites across five years. Both lineages are set out on the demo response study page.
Every figure in this report, with its base, its interval and the caveat that travels with it, is on the full figure set.
The rest of the research
Each of these takes one finding from this report and does the work the report only has room to summarize.
| What it argues | |
|---|---|
| Ask a B2B chatbot for a person and it asks for your details first | We asked 88 of them for a human and 4 produced one. The filed transcripts show bots naming the number of questions they would ask, then exceeding it |
| Drift's customers did not switch, they quit | 164 of the 319 study sites running Drift in 2021 had no chat at all by 2025. They were not abandoning a channel, they were closing an account on something nobody had answered |
| Five years of AI hype, and B2B websites went backwards | The share of B2B sites offering a buyer no way to ask anything went up across the window that produced modern language models |
| Speed to Lead is timing a robot | A metric that times every response is set by the machine, because the machine sends almost all of them |
| The chat vendors caused their own demise | An install was sold, the staffing decision was left for later, and five years on it has not been made |
| The identification tax | Buyers do not refuse people. They refuse being handled |
| Speed and personalization did not separate the humans from the robots | One signal told the two classes apart, and it was not tone, speed or a named sender. It was leaving the form |
| They changed the chat vendor. They did not change who answers. | 257 of the 585 sites identified in both waves changed supplier, 43.9% and a ceiling. Almost none of them changed who answers |
Terry Wilson is the founder of GTM Clarity and CEO of ChatMetrics, which has delivered over $5 billion in qualified pipeline and 300,000+ leads for B2B clients across SaaS, services, and industrial sectors. Before founding ChatMetrics, Terry was National Sales & Marketing Manager for a $1B enterprise, leading more than 350 people across Australia. He built GTM Clarity's AI on a corpus of 3M+ real B2B sales conversations that delivered $5B+ pipeline across 200+ companies.
Keep reading
62 B2B buyer response statistics, from five years of original research
Base for this section: 4,265 B2B technology websites, each above 10,000 monthly visitors, classified in 2021, again in 2025 and again in 2026 at the same addresses. The 2021 and 2025 figures are observed states with no coder judgment about intent, no estimation and no sampling. The 2026 wave sampled the three big groups and tried every site in the three small ones, so its figures carry confidence intervals and the first two waves do not. It is also a different instrument: 2021 and 2025 classified a site by opening the widget on one visit, while 2026 held a conversation and waited three minutes for a person.
Read →ResearchAsk a B2B chatbot for a person and it asks for your details first. On 84 of the 88 sites we asked, nobody came.
A sentence sits on a lot of B2B websites, and almost nobody has checked whether it is true.
Read →ResearchThe identification tax: why buyers refuse to tell you who they are
Your most valuable visitor this week will be somebody who stops reading, decides you might be worth an hour, and asks to talk to you. Before anybody answers, you will charge them their name, work email, phone number and company. Then you will give them almost nothing back.
Read →